AI Agent for Data Analytics: Lumina 😁🤖
Lumina allows you to upload any CSV file, ask natural language questions, and get instant Python code, Plotly visualizations, and explanations — all through a simple chat interface!
The idea behind Lumina is simple: by providing it with transaction data, I can ask questions like, “How much did I spend on each day?” or “Which category did I spend the most on?”
Lumina not only generates Python code to answer these queries, but it also explains the code, ensuring I understand how the analysis works.
Afterward, it automatically generates interactive charts using Plotly to visualize the results, making it easy to track spending patterns and understand my finances better.
A project where I combined AI reasoning and developer tools to create a smart, responsive data analysis agent.
✨ Key Features
- CSV Upload: Easily upload your datasets through the chat.
- Natural Language Queries: Ask questions like “Show me total revenue by month” or “Which category had the highest expenses?”
- Dynamic Python Code Generation: Lumina generates complete, runnable Python code for your query.
- Beautiful Plotly Charts: Instantly view interactive bar, line, scatter, and pie charts.
- Code Explanations: Understand what the code is doing — line by line, if needed.
- Flexible and Extensible: Built with future improvements in mind.
🛠️ Tech Stack
- Python — Core programming language
- Google Gemini — AI engine for reasoning and code generation
- Chainlit — Chatbot UI for an intuitive user experience
- Google AI SDK — Connecting Gemini to the backend
- Plotly — For generating professional-grade interactive charts
📸 Screenshots and Demos
1. Uploading a CSV

2. Asking a Query
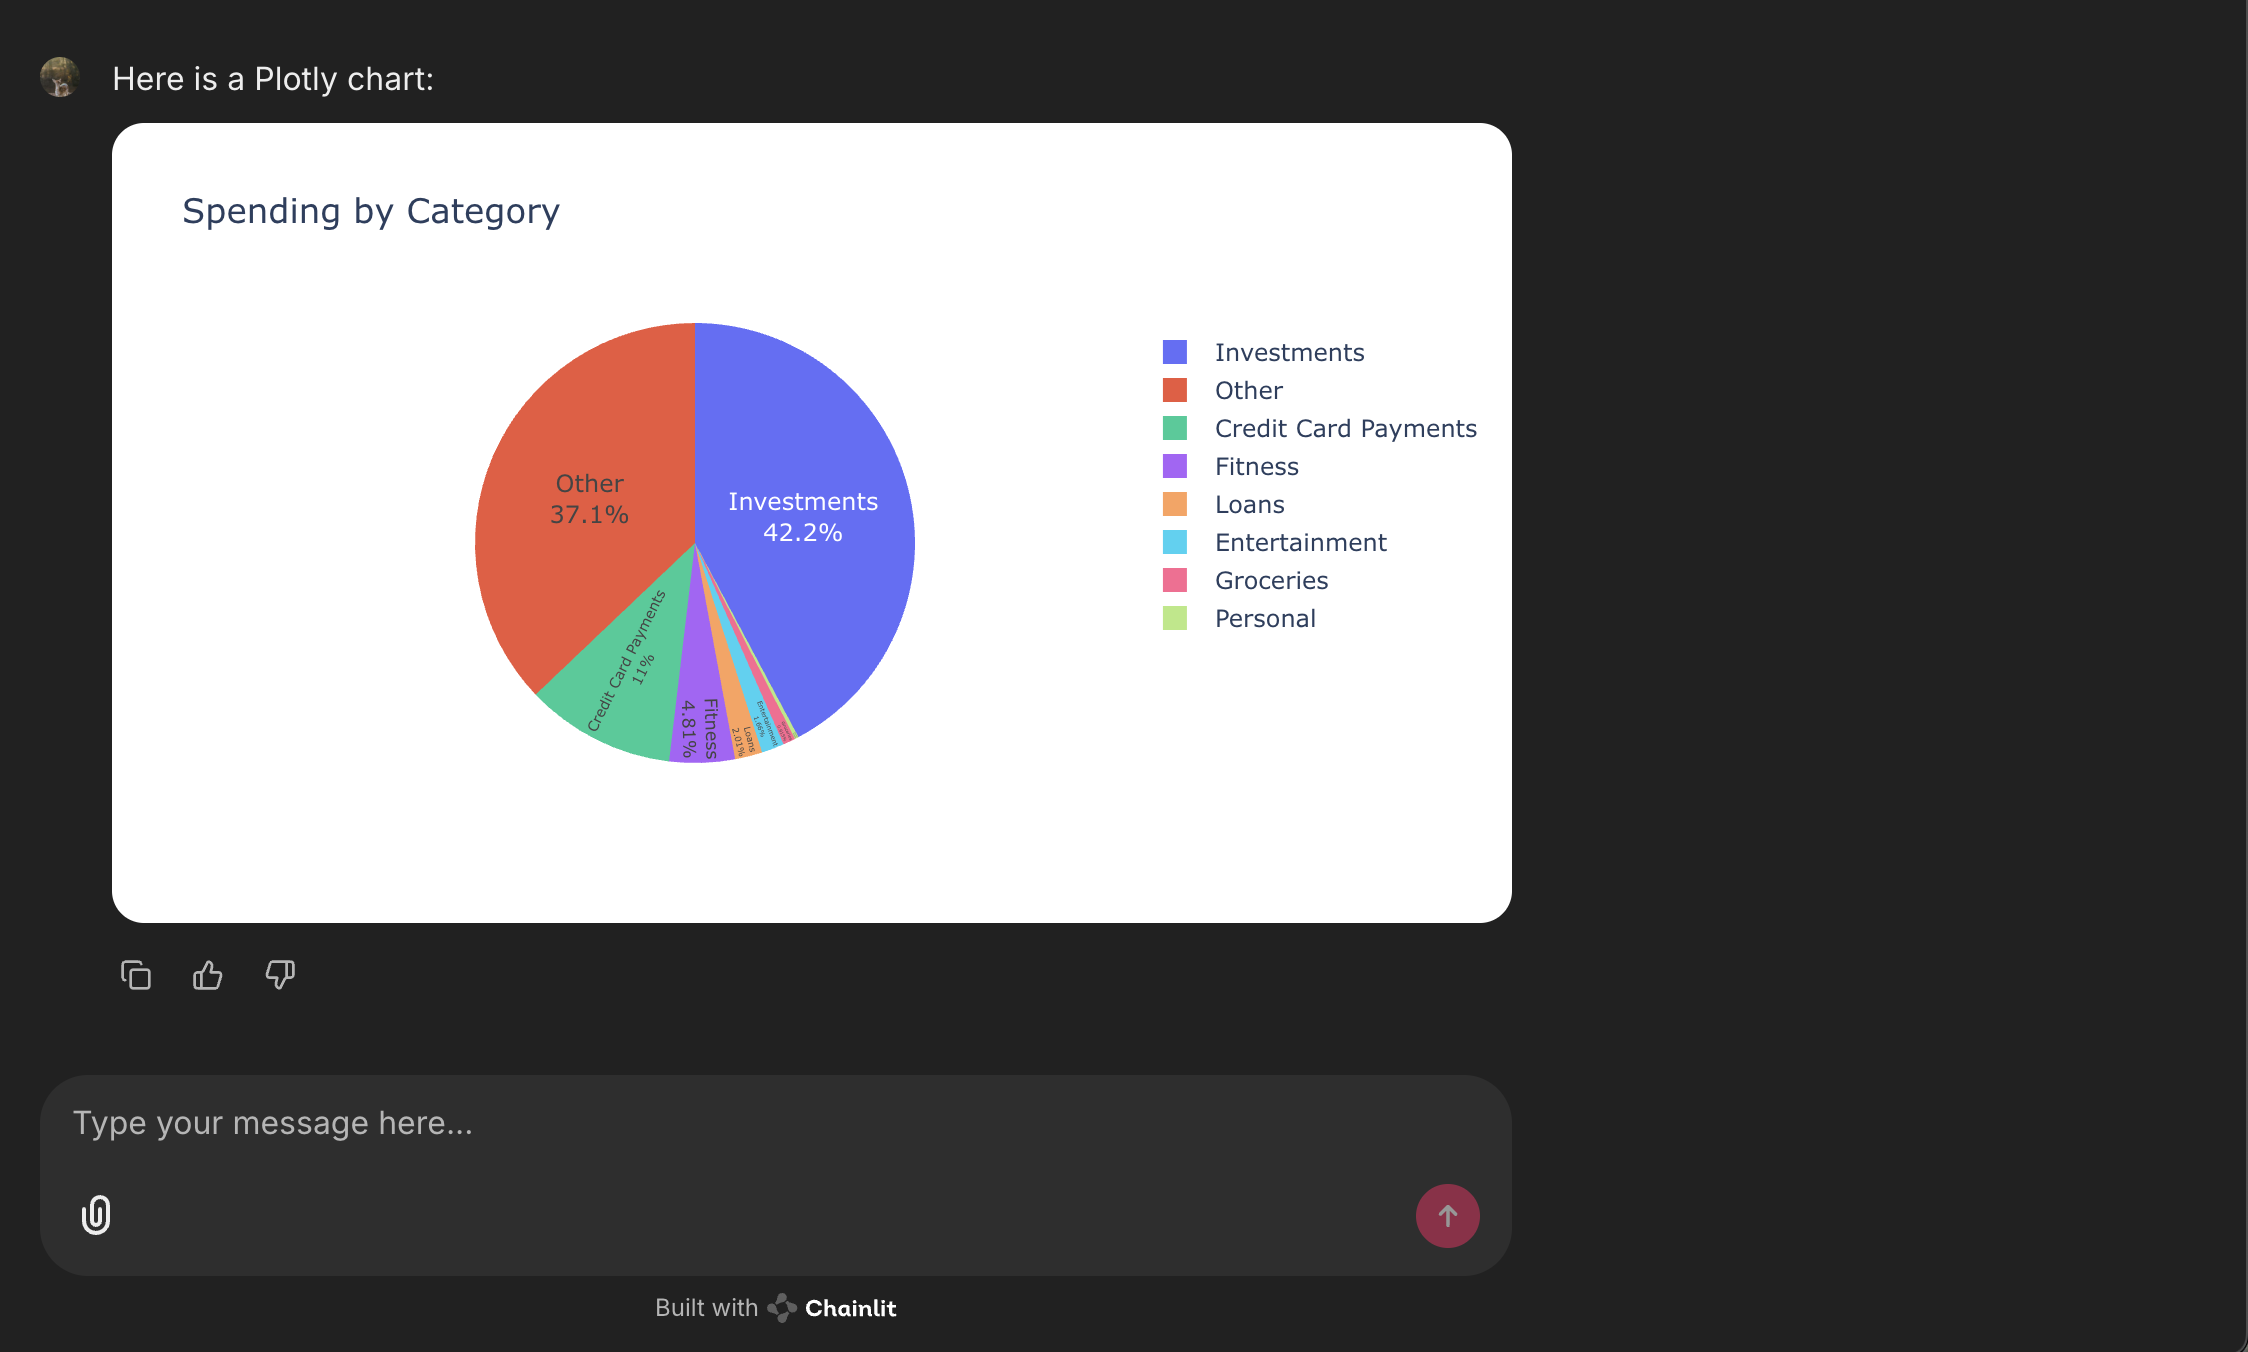
Example query:
“Given the data, make a pie chart to show how much I spent on what category.”

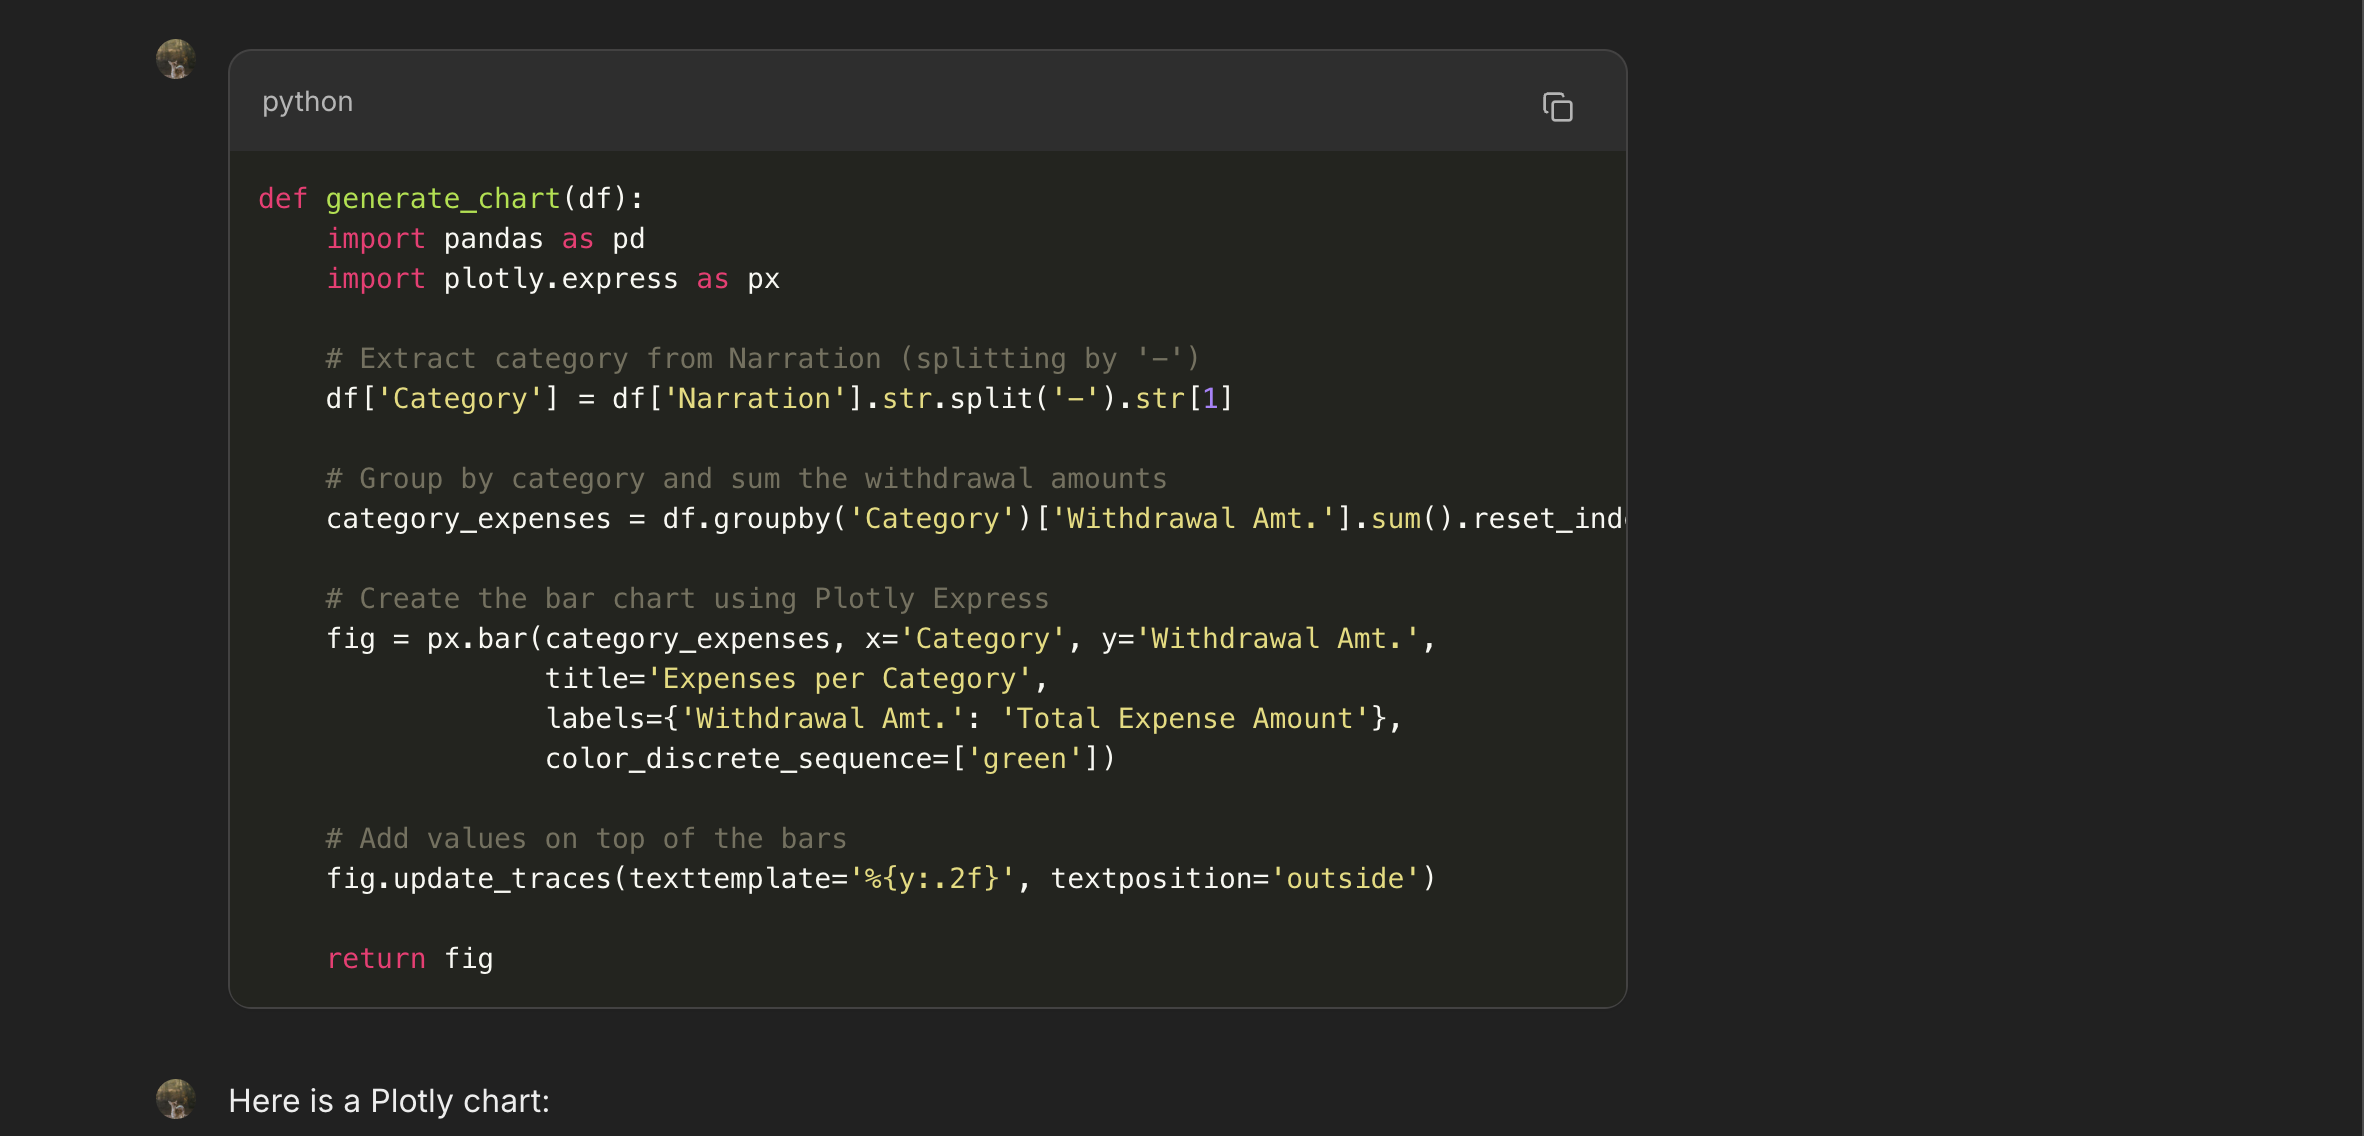
3. Generated Python Code
Lumina instantly generates clean, optimized Python scripts based on your dataset.
🧠 How Lumina Helps
Lumina can:
- Generate a
groupbyaggregation code snippet - Plot a bar chart of each category’s total spending
- Provide clear explanations of the analysis
For example:
“We grouped the data by
Category, summed theAmount, and plotted a bar chart to visualize where most of your expenses are concentrated.”
This can instantly help you identify spending patterns and optimize your personal finances without manually digging into Excel or Python every time!
🔥 Why I Built Lumina
I often found myself writing repetitive Python scripts for quick dataset explorations.
I wanted a faster, smarter way — one that combines human intuition with AI reasoning.
Lumina acts like a personal junior data analyst — freeing up my time for deeper, more strategic analysis.
Plus, building Lumina taught me a lot about how multi-modal AI models like Gemini can be practically deployed in everyday workflows.
🚀 Future Improvements
Here’s what’s next on my roadmap for Lumina:
- SQL Query Generation: Generate SQL queries from CSVs, perfect for database professionals.
- Multi-File Upload Support: Analyze relational data by joining multiple CSVs.
- Jupyter Notebook Export: Download generated code and charts as a ready-to-run notebook.
- User Sessions: Remember previous uploads and queries for longer conversations.
🎯 Final Thoughts
Building Lumina was a learning experience.
I explored the Google ADK (Agent Development Kit), LangChain, integrating agents with tools, MCP Servers, and more.
If you’re curious about the future of developer tools, data analysis, and AI agents — projects like Lumina are just the beginning.
Thanks for reading! Feel free to check out more of my projects to see what else I’m building. 🚀